POSTWAR IMMIGRATION
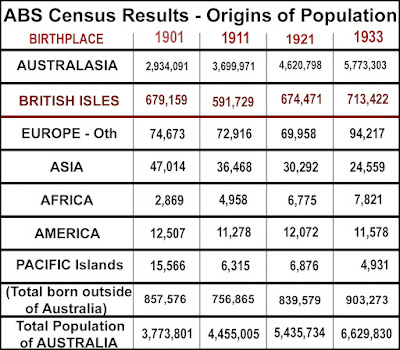
Over the first third of the twentieth century, Australia's population doubled in size but remained essentially the same in terms of its mix. It was overwhelmingly sourced from the British Isles (England, Wales, Scotland, and Ireland) with a small influence from the rest of Europe. This ethnic stability is illustrated by the first four Census results conducted after Federation in 1901 ― "(Exclusive of full-blood Aboriginals)" !
Numbers of Anglo-Celtic Australians increased over time from the 'natural increase' of a young and fertile 'settler population' derived from nineteenth century migration. Contributions from the rest of the world were relatively low and static.
Australia's demographic uniformity did not alter until after the end of the Second World War. Only in the harsh post-war realism of a nation recovering from the shock of near-invasion by the Japanese did we re-consider our traditional ideas of 'racial stock'. The urgency in popular minds was now to 'populate or perish'.
At first the new fear of geo-political isolation was not enough to uproot the White Australia Policy. Asia, Africa, South America, and the Pacific Islands, remained insignificant outliers as far as sourcing additional migrants was concerned. But we were desperate enough to disregard the smug dictum of 'wogs begin at Calais'. In the four decades following the devastation of WWII, non-British Europe emerged as more important than the 'mother country' in supplying 'New Australians'.
Comparison of Birthplace data from each Census does not provide immediate or direct records of immigration, but is good at reflecting national population trends over time. The chart above, for example, shows a slow but steady increase in British-born residents ― from 596,657 in 1947 to 878,888 in 1966 ― suggesting a net intake of approximately 370,000 over the two decades after WWII. These were the 'preferred migrants' but this pool of willing applicants was relatively limited and did not meet Australian demand.
The chart also indicates that the traditional cohort was overtaken by a corresponding supply of people of working and marriageable age from continental Europe ― rising from the low base of 144,949 to a peak of 1,014,623 in the same timeframe ― a net increase of some 870,000 and more than double the British contribution.
To put the postwar figures into perspective, the total Australian population rose by 3,971,104, between 1947 (base 7,579,358) and 1966 (total 11,550,462). This near-doubling surge was powered both by natural increase (total born inside Australia) of 2,584,371, and immigration (total born outside Australia) of 1,386,733. And, importantly, the numbers who entered the country then were, for the first time, dominated by mainland Europeans (870,000) rather than Anglo-Celts from the United Kingdom or Ireland (370,000).
The next set of tables sort the European Birthplace data into regions according to a loose definition of language type. Western Europe is classified by its majority use of English as a first language, Northern Europe by its Germanic or Nordic language base, Southern Europe by its classical Latin or Greek roots, and Eastern Europe by an 'assumed' Russian speaking dominance behind the Iron Curtain of Stalinist Communism. It is an approximate division but hopefully allows the breaking down of information into manageable pieces without resort to the old racial stereotypes.
It is plain that most of the migration of Britons to Australia was by people who were native to England. The difference between 1947 and 1966 Census figures is nearly 300,000 (299,934) for English born, falling away to about 50,000 (49,277) from Scottish shires, and 10,362 and 7,824 from Ireland and Wales respectively.
The major suppliers of postwar migrants to Australia from Northern Europe were Austria, Germany, and the Netherlands. Census Birthplace data shows a net intake of 19,335 Austrians, 94,142 Germans, and 97,375 Dutch between 1947 and 1966. All three sources demonstrate substantial immediate (1947 - 1954) and intermediate (1954-1961) population shifts, before plateauing in the final phase(1961-1966) when the flow effectively ceased.
The main contributor nations in Southern Europe were Greece, Italy, and Malta. These three sources supplied migrants in a constant stream from 1947 to 1966. Census Birthplace statistics for Italy indicate a net total intake of 233,693 over the 20 year period. Greece followed with 127,798 for same two decades and small island Malta provided another 51,866.
The main migrant donors from the Iron Curtain countries of Eastern Europe were Yugoslavia and Poland, furnishing 65,411 and 55,068 each during the years from 1947 to 1966. A second tier of donor countries were Hungary with 28,614, the Baltic states of Estonia, Latvia, and Lithuania at a combined contribution of 26,665, the Soviet Republics of Russia and Ukraine at 24,335, and Czechoslovakia with 10,689.
Nearly all of the population movement from these 'political refugee' parts of the continent occurred in the earliest period between 1947 and 1954. The only exceptions to this pattern seem to be Hungary, where the exodus continued into the second term of 1954 to 1961, and Yugoslavia, where migration followed an uninterrupted course into the latter years of 1961 to 1966.
Different rates of migration were determined by the possibility of leaving, which became uniformly difficult from most of these countries under Stalinist rule. The Hungarian exception was a brief window of revolt in 1956. Titoist Yugoslavia retained a small measure of independence from Moscow and had slightly less restrictive borders.


Comments
Post a Comment